Where to hike each month for mild weather
An explicit climate rule builds a twelve-stop planning atlas, following historically mild hiking-hour temperatures without pretending to rank the world.
10 min read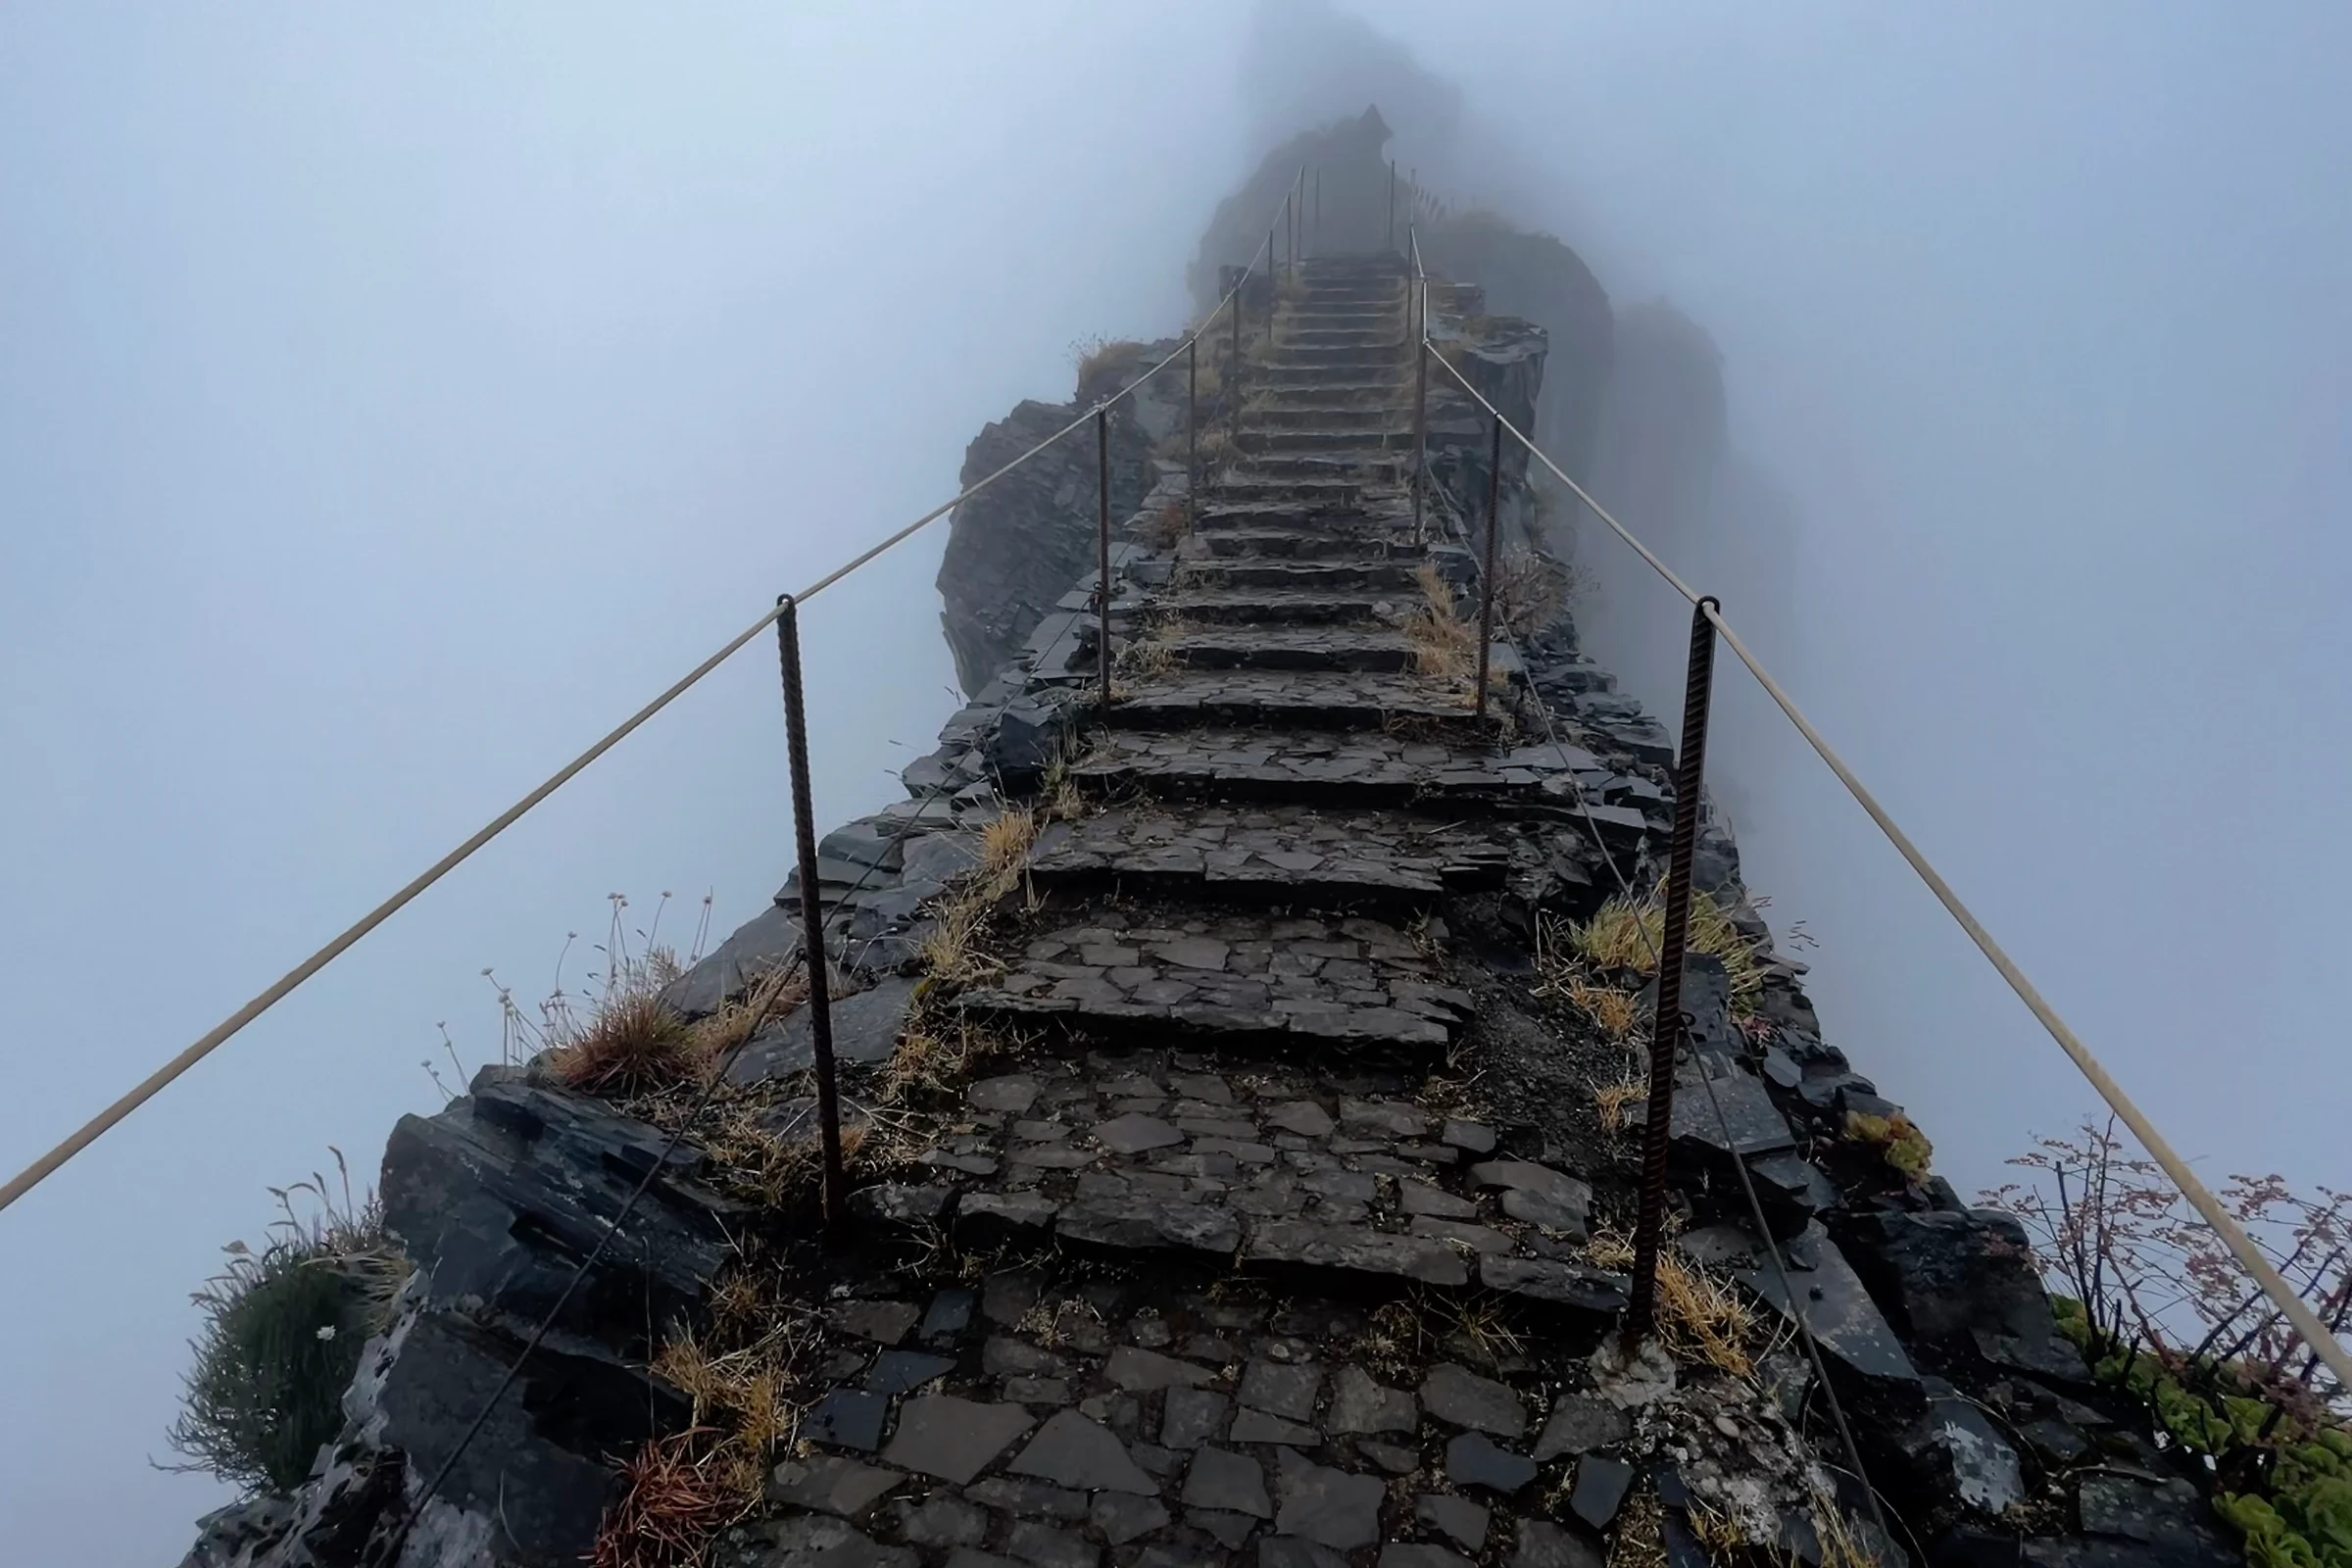
Could a traveller follow mild hiking weather around the world for a full year? The question sounds like an invitation to produce a glossy top-twelve list. This atlas takes a stricter route. Every selected month must be recommendation-eligible in the current model, have a historical hiking-hour mean from 12 to 20 °C, and show no more than 25 percent wet days at the representative cell. Each destination may appear only once. The result is not the only valid itinerary and not a claim that these are the best places on Earth. It is one transparent answer generated from the same rules in every month.
January to April: begin south, then turn north
January starts in Algeria's Hoggar Mountains at 13.0 °C during the sampled hiking hours and 1.94 percent wet days. February moves to Wadi Rum, where 13.2 °C and 7.29 percent wet days create a cooler desert profile than its excluded midsummer months. March crosses to Mexico's Copper Canyon at 14.7 °C and 9.49 percent wet days. In April, Tenerife offers 13.8 °C and 13.05 percent. The geographic jumps are deliberate. Mild conditions do not march evenly northward; elevation, ocean influence and local seasonality create separate windows.
| Quarter | Stops | Temperature span | Wet-day span |
|---|---|---|---|
| Jan–Mar | Hoggar, Wadi Rum, Copper Canyon | 13.0–14.7 °C | 1.94–9.49% |
| Apr–Jun | Tenerife, Samaria, Madeira | 13.8–18.7 °C | 13.05–17.52% |
| Jul–Sep | Larapinta, Rainier, Sequoia | 15.4–16.2 °C | 3.96–19.91% |
| Oct–Dec | Table Mountain, Anti-Atlas, Doi Inthanon | 15.1–19.5 °C | 13.64–19.08% |
May to August: Mediterranean spring to mountain summer
May's Samaria Gorge selection averages 17.5 °C with 16.50 percent wet days. June moves west to Madeira at 18.7 °C and 17.52 percent. July makes the largest climatic and geographic turn, to Australia's Larapinta Trail: 15.9 °C and only 3.96 percent wet days during Southern Hemisphere winter. August uses the short mountain window at Mount Rainier, where the representative cell has a 16.2 °C hiking-hour mean and 19.91 percent wet days. These are climate starting points, not route permissions. Gorge openings, desert water, wildfire, snowfields and park access require their own current checks.
- SeptemberSequoia & Kings Canyon15.4 °C · 19.33% wet
- OctoberTable Mountain16.9 °C · 19.08% wet
- NovemberAnti-Atlas15.1 °C · 14.95% wet
- DecemberDoi Inthanon19.5 °C · 13.64% wet
“The atlas ranks no destination; it demonstrates what one explicit preference rule produces.”
The last four stops continue the same method. September selects Sequoia and Kings Canyon at 15.4 °C and 19.33 percent wet days. October crosses to South Africa's Table Mountain at 16.9 °C and 19.08 percent. November uses Morocco's Anti-Atlas at 15.1 °C and 14.95 percent, while December finishes on Doi Inthanon at 19.5 °C and 13.64 percent. None is interchangeable with the others. Daylight, elevation, remoteness and route character differ. The constant rule provides comparability, while the destination pages restore the context removed by a compact annual view.
How to build your own version
Change one rule at a time. A warmer preference could raise the lower temperature bound; a rain-sensitive traveller might lower the 25-percent ceiling. Fix travel months that cannot move, choose a region if long-haul jumps are unrealistic, and then inspect individual month pages. Do not optimise for the overall score alone. Read the physical metrics, selected elevation and caveats, then verify official access and current forecasts. The method is more valuable than this exact route because it makes personal trade-offs visible. Another traveller can apply different limits and produce an equally defensible calendar without copying a generic best-of list.