Average hiking temperature vs daily temperature range
Two strong hiking months show why a mean temperature is only the first line of a climate decision.
6 min read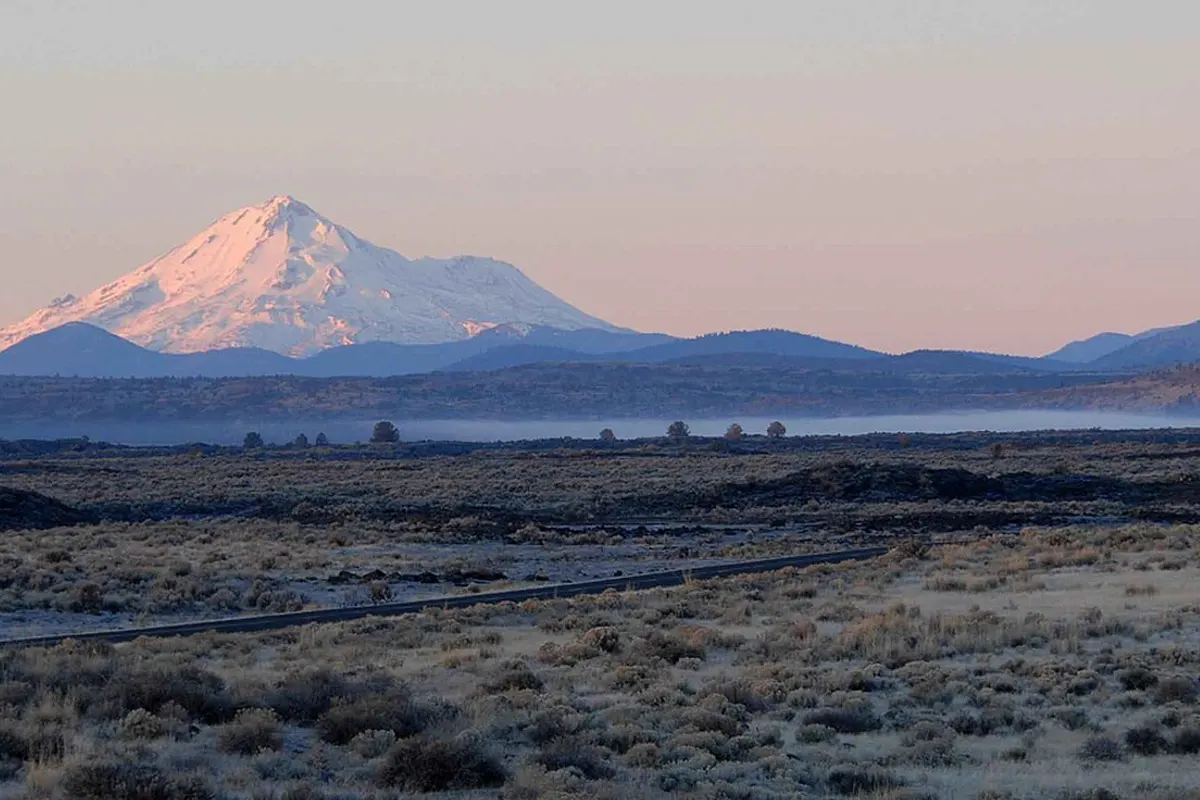
“A monthly mean tells you where the middle is. It does not tell you how wide the month feels.”
A single temperature number is easy to compare. That is also its danger. The mean temperature in a hiking month compresses warm afternoons, cold mornings and everything between them into one value. For a traveller choosing layers, start times and a route, the spread matters as much as the centre. Mount Shasta in May and Zion in October are useful contrasts: both are recommended by the model, yet their historical temperature ranges are broad enough that the same mean can support very different packing decisions. The data does not replace a forecast; it shows what a normal historical envelope looked like at the selected representative cell.
| Destination / month | Mean | P10–P90 | Range | Wet days | Score |
|---|---|---|---|---|---|
| Mount Shasta · May | 14.6 °C | 6.1–23.2 °C | 17.1 °C | 32.44% | 78 |
| Zion · October | 14.4 °C | 5.0–22.4 °C | 17.4 °C | 15.76% | 89 |
- P10Cooler sampled hoursA lower historical percentile, not a daily minimum.
- MeanThe centreA compact summary of the sampled hiking window.
- P90Warmer sampled hoursAn upper historical percentile, not a daily maximum.
Why the model keeps the average and the spread separate
The public destination data reports the mean used for the hiking-hour summary and percentile values that describe the historical distribution. The recommendation score is not a comfort guarantee and it is not built by simply adding the visible numbers. Critical gates still apply before ranking: a month that fails a critical component cannot be rescued by an attractive temperature mean. For these two examples, May at Mount Shasta and October at Zion remain eligible, but the range is a reason to plan with more detail than the score alone suggests. A hiker comparing them should ask whether the intended route is an exposed ridge, a shaded canyon, a high trailhead or a short low-elevation walk.
Percentiles are especially useful for deciding what to verify next. P10 is a lower historical reference, not a guaranteed minimum; P90 is an upper reference, not a forecast of the hottest day on your trip. The interval is deliberately descriptive. It helps explain why two destinations with nearly identical means can feel operationally different, while leaving current weather, wind exposure, shade, altitude effects and route conditions to local sources. It also avoids the false precision of telling a traveller that 14.6 °C is the temperature they will experience.
This is also why the order of a comparison matters. First decide whether the month is available under the site's critical gates. Then use the mean to understand the broad thermal setting. Only after that should the P10–P90 interval shape your equipment and timing questions. At Mount Shasta, a May plan may need a cold-start layer and a check on lingering high-elevation snow even when the afternoon looks comfortable. In Zion, October's range invites a similar check for cool mornings, but the lower wet-day share changes the rain question. Neither example supports a universal packing list; both support a better one.
A range is most informative when it is connected to a decision the traveller can actually make. Ask whether the trailhead is near the representative elevation, whether the route climbs substantially above it and whether the walking window is the same as the modelled window. If the answer is no, treat the public record as context rather than a direct description. This is a more honest use of historical climate data than turning a percentile into a promise, and it gives the current forecast a clear job: update the historical context for the exact dates and route.